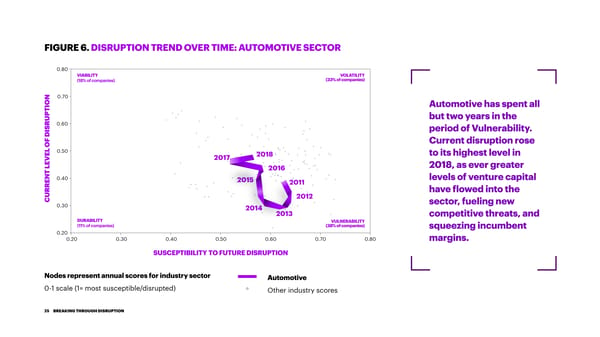
FIGURE 6. DISRUPTION TREND OVER TIME: AUTOMOTIVE SECTOR 0.80 VIABILITY VOLATILITY (18% of companies) (33% of companies) N 0.70 O Automotive has spent all I T P but two years in the U 0.60 R S period of Vulnerability. I D F Current disruption rose O L 0.50 to its highest level in E 2017 2018 V E 2018, as ever greater L 2016 T N 0.40 2015 levels of venture capital E 2011 R have flowed into the R U 2012 C 0.30 sector, fueling new 2014 2013 competitive threats, and DURABILITY VULNERABILITY (11% of companies) (38% of companies) squeezing incumbent 0.20 0.20 0.30 0.40 0.50 0.60 0.70 0.80 margins. SUSCEPTIBILITY TO FUTURE DISRUPTION Nodes represent annual scores for industry sector Automotive 0-1 scale (1= most susceptible/disrupted) Other industry scores 25 BREAKING THROUGH DISRUPTION
 Breaking Through Disruption Page 24 Page 26