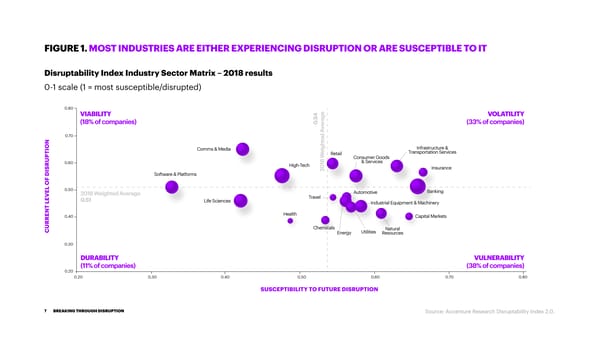
FIGURE 1. MOST INDUSTRIES ARE EITHER EXPERIENCING DISRUPTION OR ARE SUSCEPTIBLE TO IT Disruptability Index Industry Sector Matrix – 2018 results 0-1 scale (1 = most susceptible/disrupted) 0.80 VIABILITY VOLATILITY 4 (18% of companies) 5 age (33% of companies) 0. er v 0.70 ION Comms & Media eighted A Infrastructure & T Retail Transportation Services P Consumer Goods U 0.60 & Services R High-Tech 018 W Insurance S 2 I Software & Platforms L OF D 0.50 Banking E 2018 Weighted Average Automotive V Travel E 0.51 Life Sciences Industrial Equipment & Machinery T L N Health E 0.40 Capital Markets R R U Chemicals Natural C Energy Utilities Resources 0.30 DURABILITY VULNERABILITY (11% of companies) (38% of companies) 0.20 0.20 0.30 0.40 0.50 0.60 0.70 0.80 SUSCEPTIBILITY TO FUTURE DISRUPTION 7 BREAKING THROUGH DISRUPTION Source: Accenture Research Disruptability Index 2.0.
 Breaking Through Disruption Page 6 Page 8