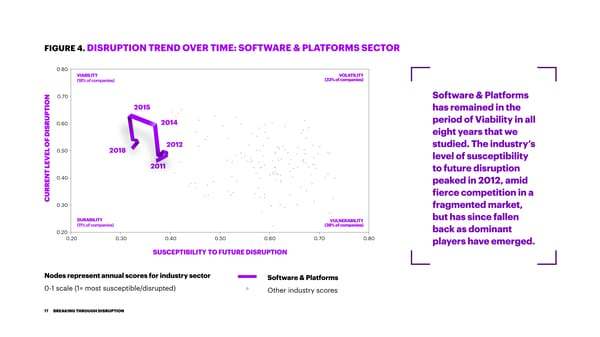
FIGURE 4. DISRUPTION TREND OVER TIME: SOFTWARE & PLATFORMS SECTOR 0.80 VIABILITY VOLATILITY (18% of companies) (33% of companies) N 0.70 Software & Platforms O I 2015 has remained in the T P U 0.60 2014 period of Viability in all R S I eight years that we D F 2012 studied. The industry’s O L 0.50 2018 E level of susceptibility V E L 2011 to future disruption T N 0.40 E peaked in 2012, amid R R fierce competition in a U C 0.30 fragmented market, DURABILITY VULNERABILITY but has since fallen (11% of companies) (38% of companies) back as dominant 0.20 0.20 0.30 0.40 0.50 0.60 0.70 0.80 players have emerged. SUSCEPTIBILITY TO FUTURE DISRUPTION Nodes represent annual scores for industry sector Software & Platforms 0-1 scale (1= most susceptible/disrupted) Other industry scores 17 BREAKING THROUGH DISRUPTION
 Breaking Through Disruption Page 16 Page 18