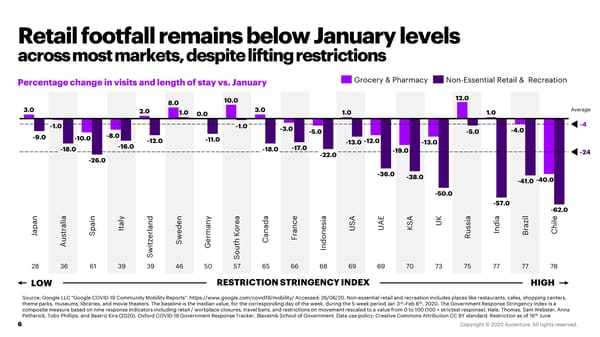
Retail footfall remains below January levels across most markets, despite lifting restrictions Percentage change in visits and length of stay vs. January Grocery & Pharmacy Non-Essential Retail & Recreation 8.0 10.0 12.0 3.0 2.0 1.0 0.0 3.0 1.0 1.0 Average -1.0 -1.0 -3.0 -4.0 -4 -9.0 -8.0 -5.0 -5.0 -10.0 -12.0 -11.0 -13.0 -12.0 -13.0 -18.0 -16.0 -18.0 -17.0 -19.0 -24 -26.0 -22.0 -36.0 -38.0 -40.0 -41.0 -50.0 -57.0 l -62.0 a n y y a a a E a a i e i i i z l an al al nd en e ce SA SA UK di a i t a ad UA K ssi r Spa I l ed man or an nes U u In Br Ch Jap st er w r K r o R u z S e h Can F t A i G nd w out I S S 28 36 61 39 39 46 50 57 65 66 68 69 69 70 73 75 77 77 78 LOW RESTRICTION STRINGENCY INDEX HIGH Source: Google LLC "Google COVID-19 Community Mobility Reports". https://www.google.com/covid19/mobility/ Accessed: 26/06/20. Non-essential retail and recreation includes places like restaurants, cafes, shopping centers, rd th theme parks, museums, libraries, and movie theaters. The baseline is the median value, for the corresponding day of the week, during the 5-week period Jan 3 –Feb 6 , 2020. The Government Response Stringency Index is a composite measure based on nine response indicators including retail / workplace closures, travel bans, and restrictions on movement rescaled to a value from 0 to 100 (100 = strictest response). Hale, Thomas, Sam Webster, Anna th Petherick, Toby Phillips, and Beatriz Kira (2020). Oxford COVID-19 Government Response Tracker, BlavatnikSchool of Government. Data use policy: Creative Commons Attribution CC BY standard. Restriction as of 16 June 6
 COVID-19: How is the Retail Consumer Changing? Page 5 Page 7