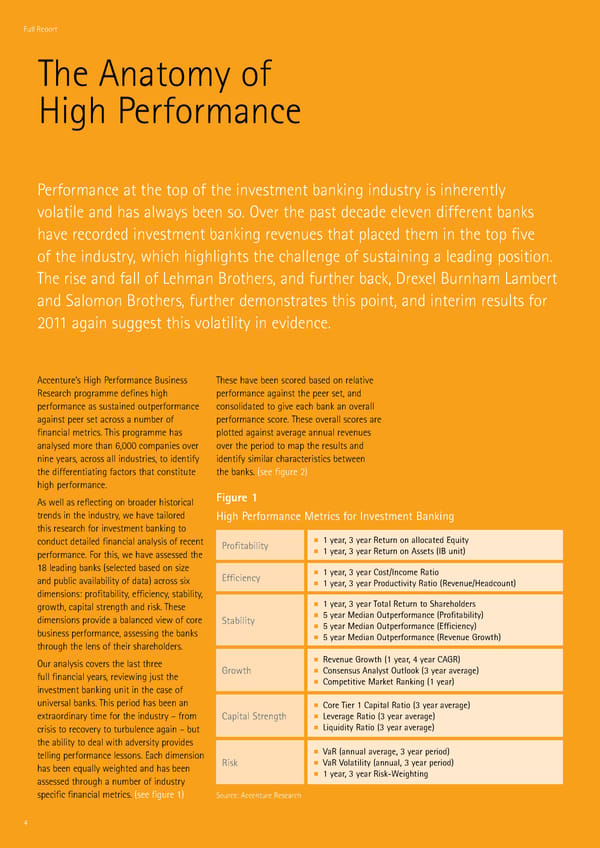
Full ReportFull Report The Anatom of High Performance Performance at the top of the investment ‚anking industr is inherentl volatile and has alas ‚een soˆ ˜ver the past decade eleven different ‚anks have recorded investment ‚anking revenues that placed them in the top five of the industr‡ hich highlights the challenge of sustaining a leading positionˆ The rise and fall of ›ehman Brothers‡ and further ‚ack‡ œre‘el Burnham ›am‚ert and Salomon Brothers‡ further demonstrates this point‡ and interim results for 2”€€ again suggest this volatilit in evidenceˆ Accenture’s High Performance Business These have ‚een scored ‚ased on relative Research programme defines high performance against the peer set‡ and performance as sustained outperformance consolidated to give each ‚ank an overall against peer set across a num‚er of performance scoreˆ These overall scores are financial metricsˆ This programme has plotted against average annual revenues analsed more than †‡””” companies over over the period to map the results and nine ears‡ across all industries‡ to identif identif similar characteristics ‚eteen the differentiating factors that constitute the ‚anksˆ –see figure 2— high performanceˆ As ell as reflecting on ‚roader historical Figure 1 trends in the industr‡ e have tailored High Performance Metrics for Investment Banking this research for investment ‚anking to conduct detailed financial analsis of recent Profitability 1 year, 3 year Return on allocated Euity performanceˆ For this‡ e have assessed the 1 year, 3 year Return on ssets IB unit €• leading ‚anks –selected ‚ased on siŽe 1 year, 3 year ostIncome Ratio and pu‚lic availa‚ilit of data— across si‘ Efficiency 1 year, 3 year Productivity Ratio RevenueHeadcount dimensions profita‚ilit‡ efficienc‡ sta‚ilit‡ groth‡ capital strength and riskˆ These 1 year, 3 year otal Return to hareholders dimensions provide a ‚alanced vie of core tability € year Median ‚utƒerformance Profitability ‚usiness performance‡ assessing the ‚anks € year Median ‚utƒerformance Efficiency € year Median ‚utƒerformance Revenue „ro…th through the lens of their shareholdersˆ ˜ur analsis covers the last three Revenue „ro…th 1 year, † year „R full financial ears‡ revieing ™ust the „ro…th onsensus nalyst ‚utlook 3 year average investment ‚anking unit in the case of omƒetitive Market Ranking 1 year universal ‚anksˆ This period has ‚een an ore ier 1 aƒital Ratio 3 year average e‘traordinar time for the industr – from aƒital trength ‡everage Ratio 3 year average crisis to recover to tur‚ulence again – ‚ut ‡iuidity Ratio 3 year average the a‚ilit to deal ith adversit provides telling performance lessonsˆ šach dimension ˆaR annual average, 3 year ƒeriod has ‚een eŒuall eighted and has ‚een Risk ˆaR ˆolatility annual, 3 year ƒeriod assessed through a num‚er of industr 1 year, 3 year Risk‰Šeighting specific financial metricsˆ –see figure €— Source Accenture Research
 Focus for Success | Full Report Page 4 Page 6