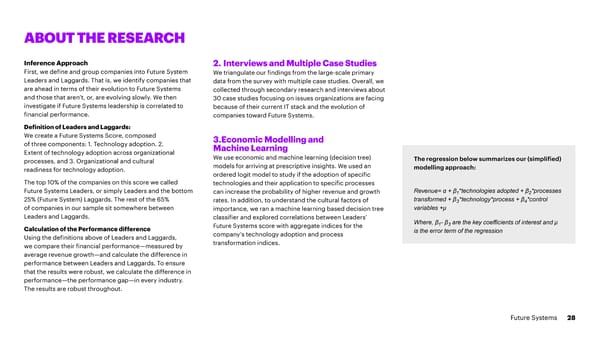
ABOUT THE RESEARCH Inference Approach 2. Interviews and Multiple Case Studies First, we define and group companies into Future System We triangulate our findings from the large-scale primary Leaders and Laggards. That is, we identify companies that data from the survey with multiple case studies. Overall, we are ahead in terms of their evolution to Future Systems collected through secondary research and interviews about and those that aren’t, or, are evolving slowly. We then 30 case studies focusing on issues organizations are facing investigate if Future Systems leadership is correlated to because of their current IT stack and the evolution of financial performance. companies toward Future Systems. Definition of Leaders and Laggards: We create a Future Systems Score, composed 3.Economic Modelling and of three components: 1. Technology adoption. 2. Machine Learning Extent of technology adoption across organizational We use economic and machine learning (decision tree) processes, and 3. Organizational and cultural The regression below summarizes our (simplified) readiness for technology adoption. models for arriving at prescriptive insights. We used an modelling approach: ordered logit model to study if the adoption of specific The top 10% of the companies on this score we called technologies and their application to specific processes Future Systems Leaders, or simply Leaders and the bottom can increase the probability of higher revenue and growth Revenue= α + β *technologies adopted + β *processes 1 2 25% (Future System) Laggards. The rest of the 65% rates. In addition, to understand the cultural factors of transformed + β *technology*process + β *control 3 4 of companies in our sample sit somewhere between importance, we ran a machine learning based decision tree variables +μ Leaders and Laggards. classifier and explored correlations between Leaders’ Where, β - β are the key coefficients of interest and μ Calculation of the Performance difference Future Systems score with aggregate indices for the 1 3 company’s technology adoption and process is the error term of the regression Using the definitions above of Leaders and Laggards, transformation indices. we compare their financial performance—measured by average revenue growth—and calculate the difference in performance between Leaders and Laggards. To ensure that the results were robust, we calculate the difference in performance—the performance gap—in every industry. The results are robust throughout. Future Systems 28
 Full Value. Full Stop Page 28 Page 30