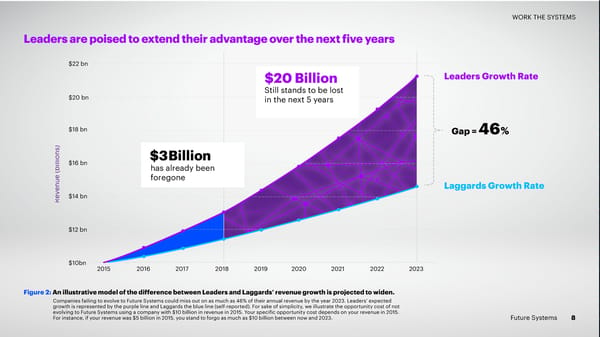
WORK THE SYSTEMS Leaders are poised to extend their advantage over the next five years $22 bn Leaders Growth Rate $20 Billion Still stands to be lost $20 bn in the next 5 years $18 bn Gap = 46% $16 bn $3Billi on has already been foregone Laggards Growth Rate Revenue (billions)$14 bn $12 bn $10bn 2015 2016 2017 2018 2019 2020 2021 2022 2023 Figure 2: An illustrative model of the difference between Leaders and Laggards’ revenue growth is projected to widen. Companies failing to evolve to Future Systems could miss out on as much as 46% of their annual revenue by the year 2023. Leaders’ expected growth is represented by the purple line and Laggards the blue line (self-reported). For sake of simplicity, we illustrate the opportunity cost of not evolving to Future Systems using a company with $10 billion in revenue in 2015. Your specific opportunity cost depends on your revenue in 2015. For instance, if your revenue was $5 billion in 2015, you stand to forgo as much as $10 billion between now and 2023. Future Systems 8
 Full Value. Full Stop Page 8 Page 10