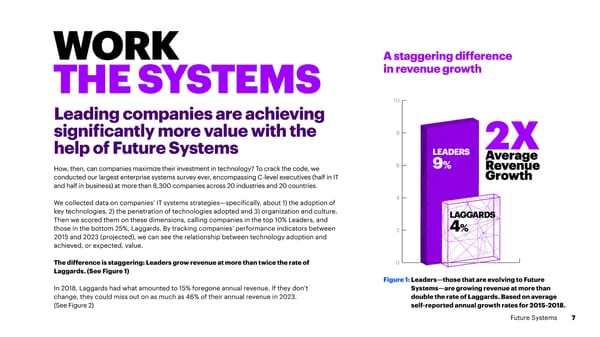
WORK A staggering difference THE SYSTEMS in revenue growth Leading companies are achieving 10 8 significantly more value with the help of Future Systems LEADERS How, then, can companies maximize their investment in technology? To crack the code, we 6 9% conducted our largest enterprise systems survey ever, encompassing C-level executives (half in IT and half in business) at more than 8,300 companies across 20 industries and 20 countries. 4 We collected data on companies’ IT systems strategies—specifically, about 1) the adoption of key technologies, 2) the penetration of technologies adopted and 3) organization and culture. LAGGARDS Then we scored them on these dimensions, calling companies in the top 10% Leaders, and those in the bottom 25%, Laggards. By tracking companies’ performance indicators between 2 4% 2015 and 2023 (projected), we can see the relationship between technology adoption and achieved, or expected, value. The difference is staggering: Leaders grow revenue at more than twice the rate of 0 Laggards. (See Figure 1) Figure 1: Leaders—those that are evolving to Future In 2018, Laggards had what amounted to 15% foregone annual revenue. If they don’t Systems—are growing revenue at more than change, they could miss out on as much as 46% of their annual revenue in 2023. double the rate of Laggards. Based on average (See Figure 2) self-reported annual growth rates for 2015-2018. Future Systems 7
 Full Value. Full Stop Page 7 Page 9