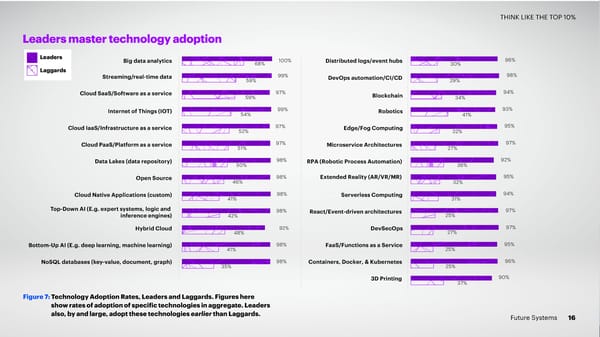
THINK LIKE THE TOP 10% Leaders master technology adoption Leaders Big data analytics 100% Distributed logs/event hubs 96% 68% 30% Laggards 98% Streaming/real-time data 59% 99% DevOps automation/CI/CD 29% Cloud SaaS/Software as a service 97% Blockchain 94% 59% 34% Internet of Things (IOT) 99% Robotics 93% 54% 41% Cloud IaaS/Infrastructure as a service 97% Edge/Fog Computing 95% 52% 32% Cloud PaaS/Platform as a service 97% Microservice Architectures 97% 51% 27% Data Lakes (data repository) 98% RPA (Robotic Process Automation) 92% 50% 36% Open Source 98% Extended Reality (AR/VR/MR) 95% 46% 32% Cloud Native Applications (custom) 98% Serverless Computing 94% 41% 31% Top-Down AI (E.g. expert systems, logic and 98% React/Event-driven architectures 97% inference engines) 42% 25% 97% Hybrid Cloud 48% 92% DevSecOps 27% Bottom-Up AI (E.g. deep learning, machine learning) 98% FaaS/Functions as a Service 25% 95% 41% NoSQL databases (key-value, document, graph) 98% Containers, Docker, & Kubernetes 96% 35% 25% 3D Printing 90% 37% Figure 7: Technology Adoption Rates, Leaders and Laggards. Figures here show rates of adoption of specific technologies in aggregate. Leaders also, by and large, adopt these technologies earlier than Laggards. Future Systems 16
 Full Value. Full Stop Page 16 Page 18